
Health Checks vs Heartbeats
(4 Minutes) | What They Do, When to Use Each, and How They Work Together in Real Systems


Postgres, Reimagined for the AI Era
Presented by Tiger Data
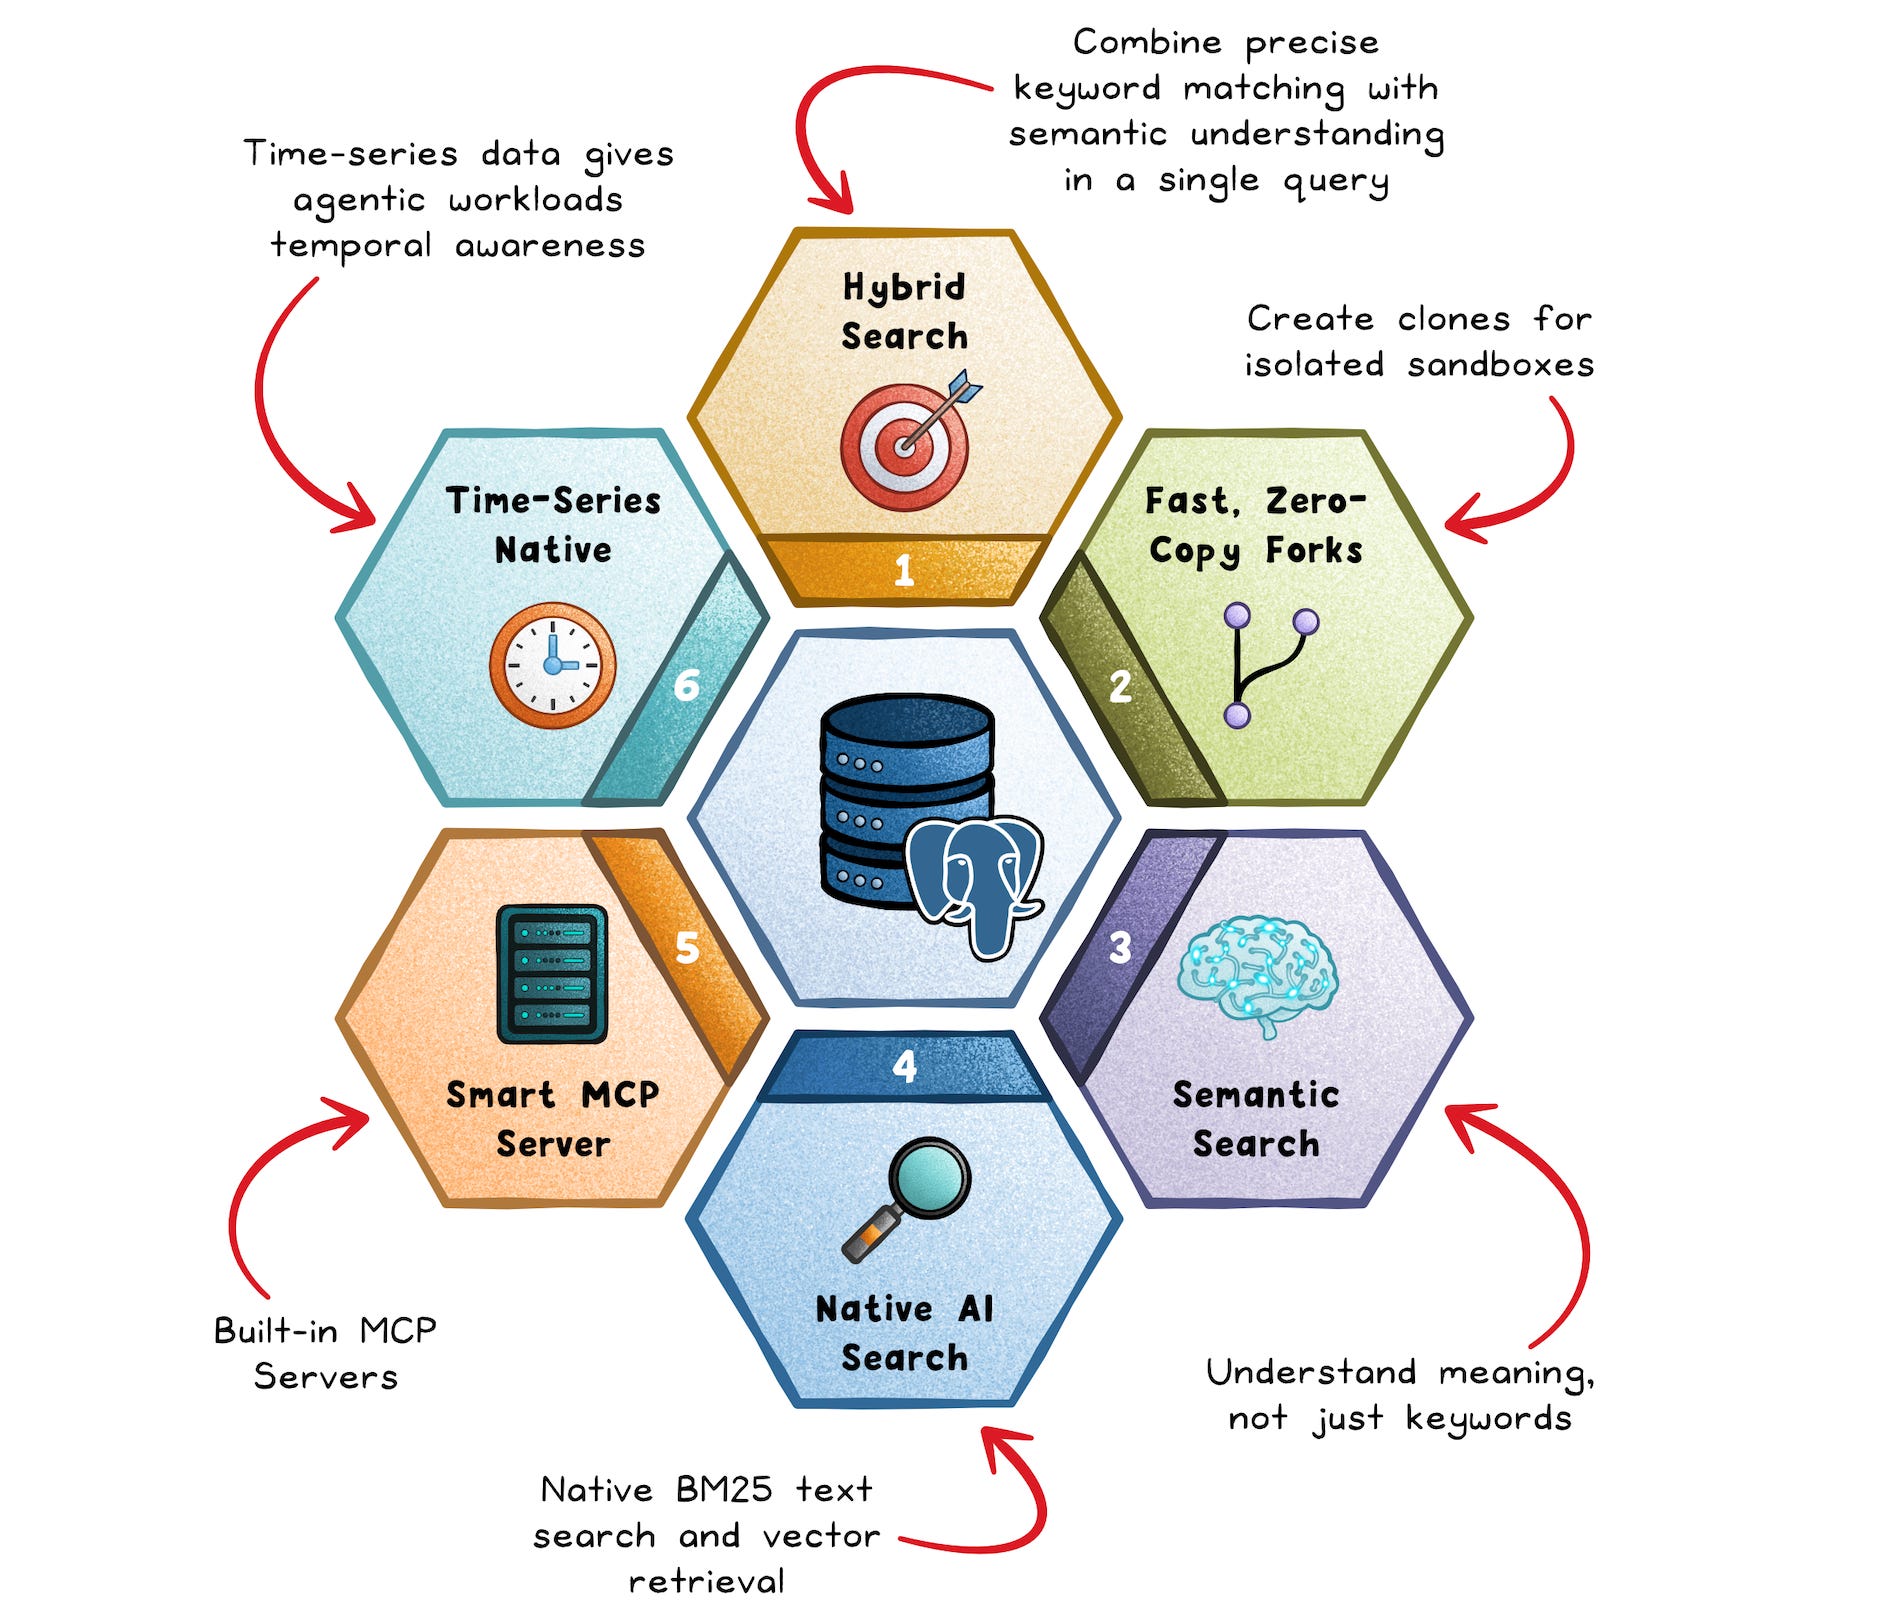
Agentic Postgres is a PostgreSQL database purpose-built for AI agents and Developers. It combines MCP integration, vector embeddings, hybrid search, time-series analytics, and observability in a single, intelligent platform. There’s a free tier (no credit card required).
Health Checks vs Heartbeats: What They Do and When to Use Each
Your dashboard says every instance is “healthy,” but users still see errors.
The problem? “Healthy” and “alive” aren’t the same thing.
Many teams mix up health checks and heartbeats, leading to slow failovers and false recoveries.
Understanding the difference helps you detect failures faster and build systems that recover gracefully.
The Difference
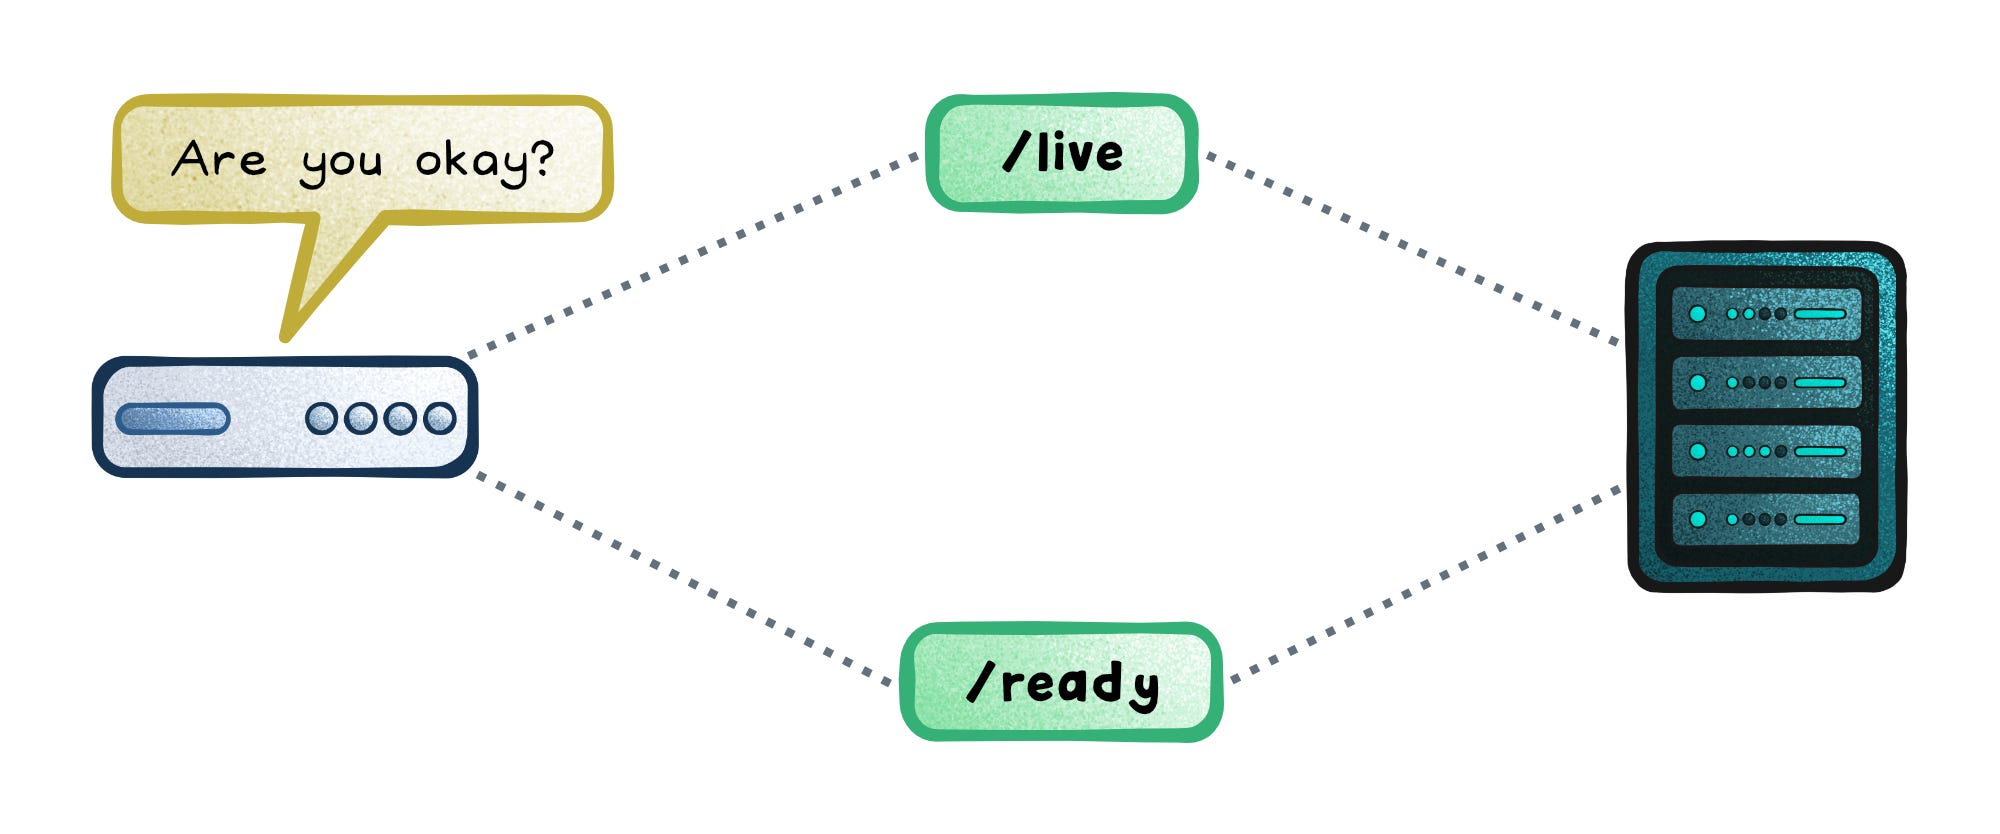
A health check is an external request that asks a service, “Are you OK?”
It’s how load balancers and orchestrators decide which instances should receive traffic or restart.
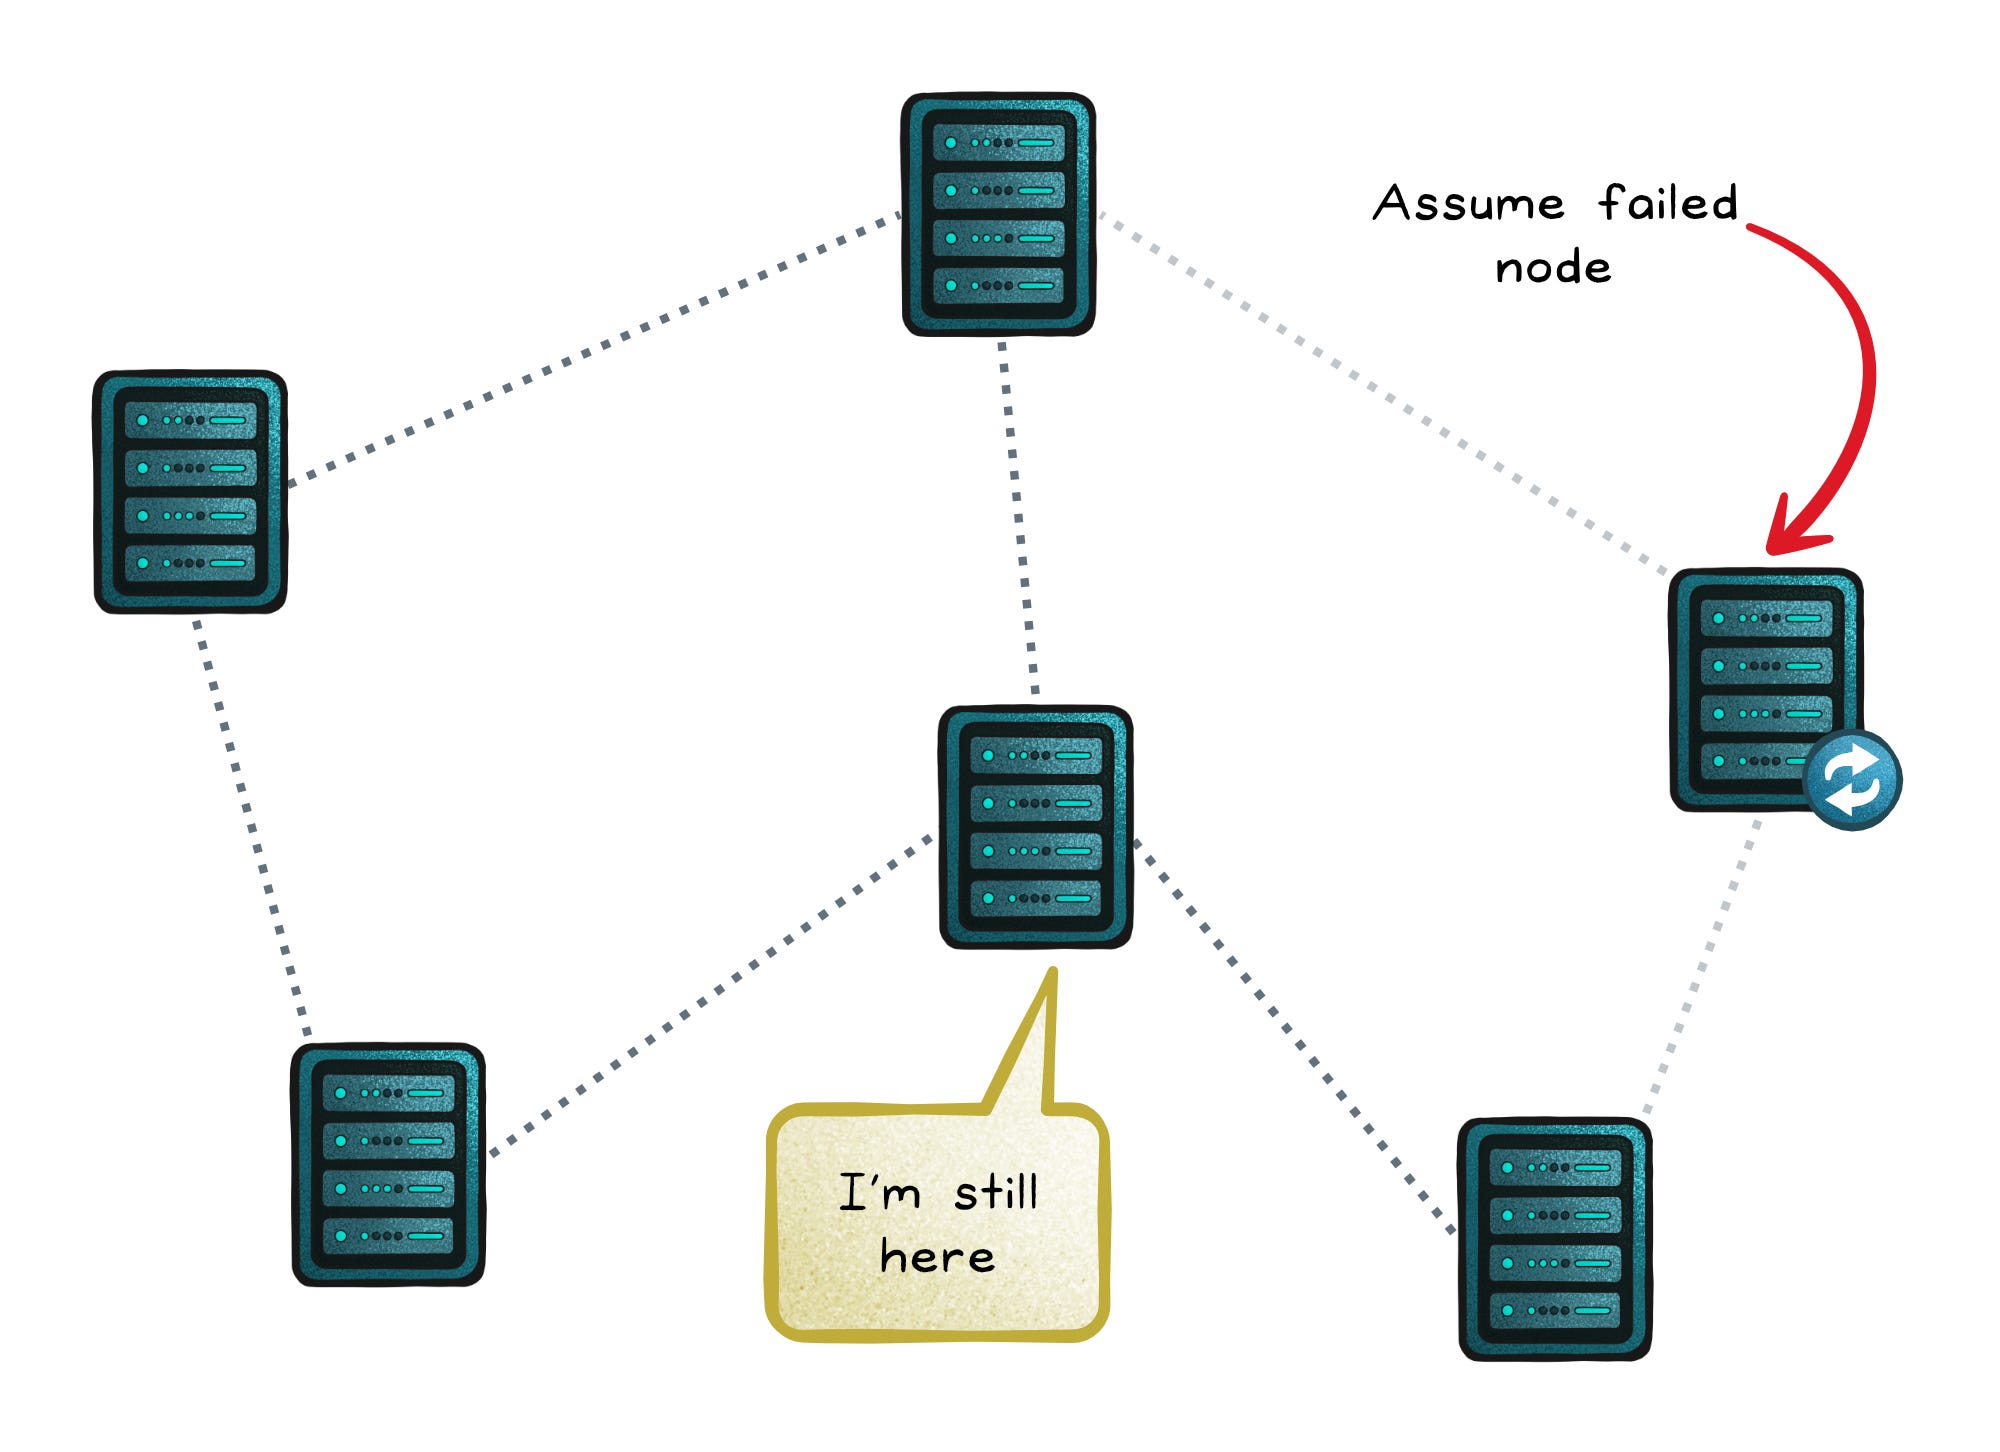
A heartbeat is the opposite: a service saying “I’m still here.” It’s a periodic signal sent to peers or coordinators so the system knows who’s alive.
The key distinction is direction:
Health checks pull from the outside to verify readiness.
Heartbeats push from the inside to confirm presence.
Used together, they answer two different questions that every reliable system needs:
Can this instance serve traffic right now?
Is this component still part of the system?
How They Work Together in Real Systems
In practice, you rarely choose between health checks and heartbeats; you use both.
They monitor different layers of a system: one keeps users safe from bad instances, the other keeps systems coordinated under load or failure.
Application layer → “Is it ready to serve?”
Each service exposes two simple endpoints: /live and /ready.
Liveness tells the orchestrator (like Kubernetes) that the process is still running and responsive. If it fails repeatedly, the pod is restarted.
Readiness tells the load balancer that the instance can handle traffic. When a readiness probe fails, the instance is marked unready, and the load balancer stops sending it new requests until it recovers.
This separation prevents cascading restarts when dependencies flicker. The service stays up but quietly steps out of rotation until it’s safe to rejoin.
Cluster layer → “Is this node still part of the system?”
At the cluster level, components send heartbeats to peers or a coordinator at short and regular intervals.
If those beats stop for too long, the system assumes the node has failed and redistributes its work; triggering leader election, partition reassignment, or replica recovery.
Heartbeats keep distributed systems self-healing, ensuring coordination continues even when individual nodes drop out.
Monitoring layer → “Do all signals agree?”
Monitoring combines both perspectives:
Synthetic health checks simulate real user requests to see if functionality holds up.
Heartbeats and telemetry show that nodes and services are alive and performing.
When those signals disagree, it’s often not a clean outage; it’s a gray failure.
Gray Failures and Signal Disagreement
A gray failure occurs when a system is partially degraded but still appears healthy to some monitoring signals. It’s the difference between “up” and “working well.”
These failures hide in plain sight. One component keeps beating, another keeps passing checks, yet the user experience quietly breaks.
They’re the hardest issues to diagnose because neither signal alone tells the full story.
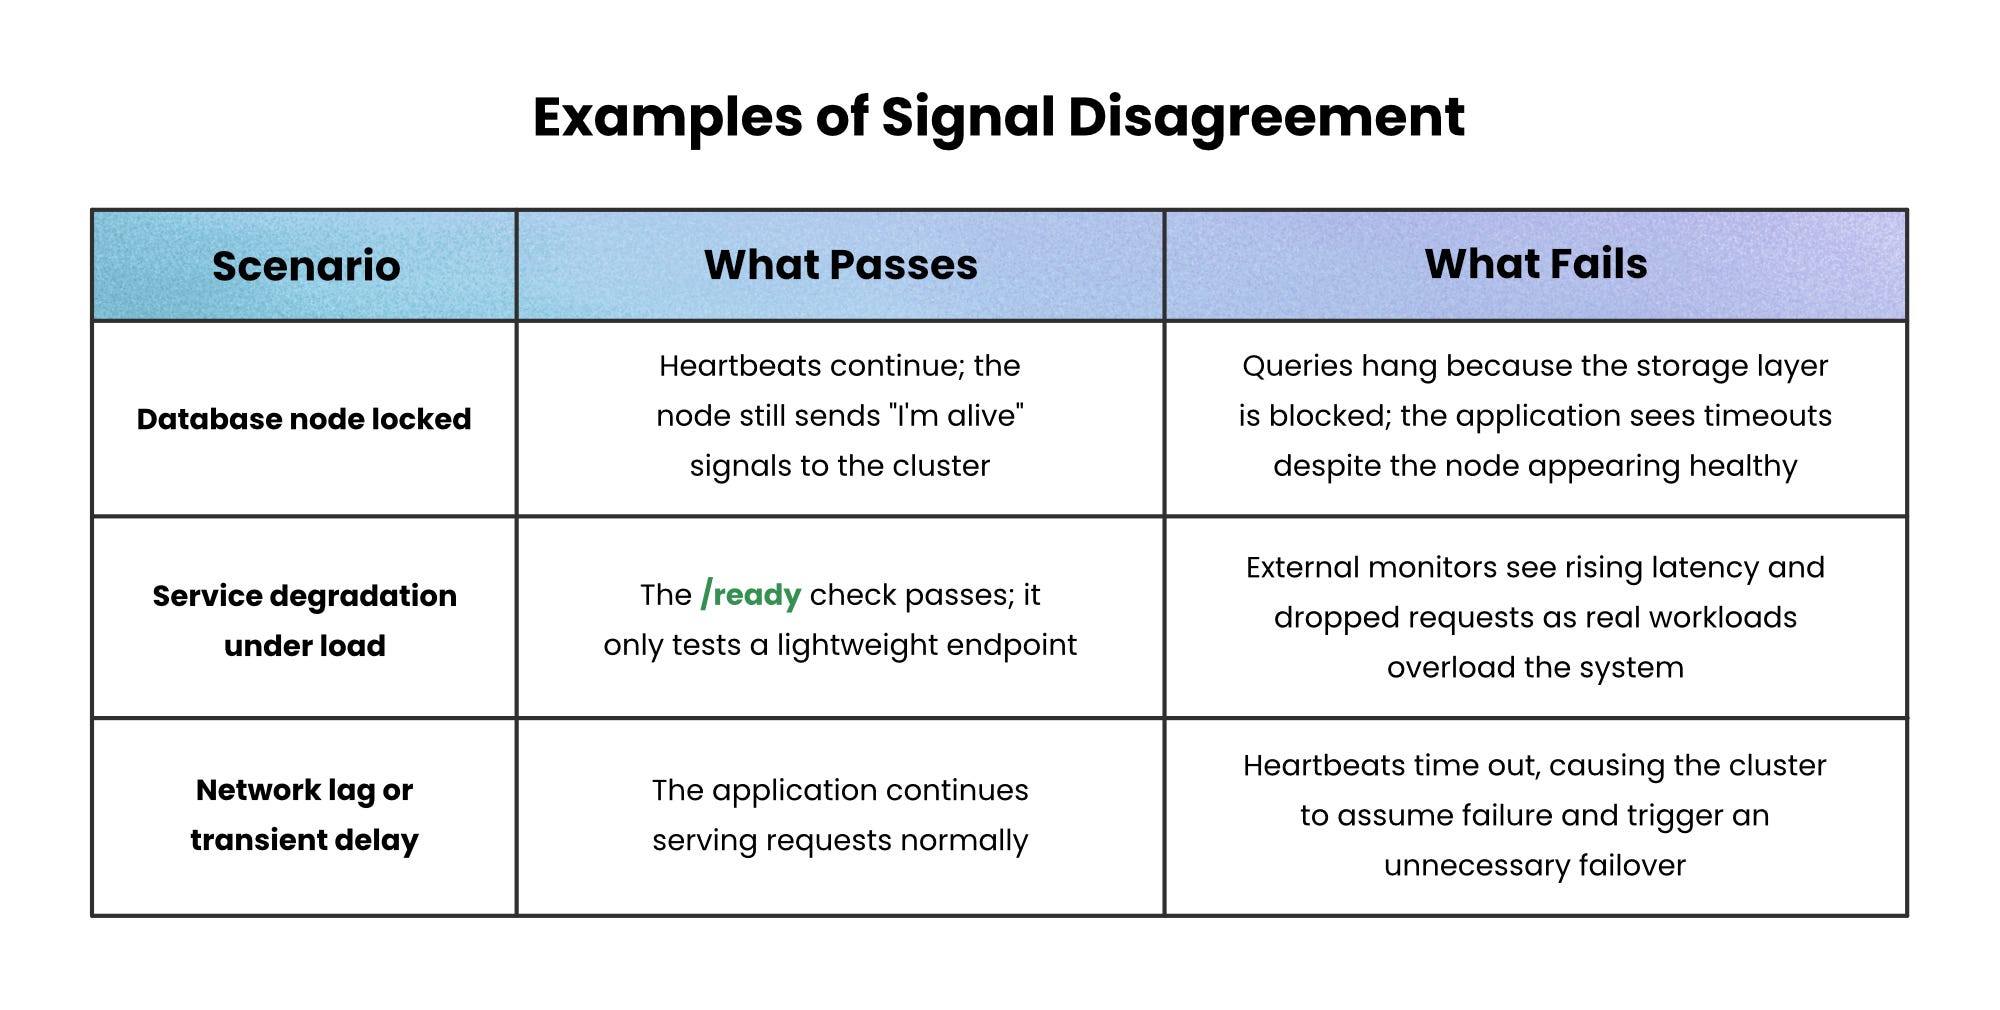
Each example shows a disagreement between what’s visible inside the system and what’s experienced outside it.
Health checks and heartbeats together narrow that gap, but only correlation between them exposes gray failures fully.
Common Failure Modes
Even when the signals work, the configuration sometimes doesn’t.
Most reliability incidents don’t come from missing checks, but from checks that are too deep, too shallow, or too frequent.
Overloaded probes → Health endpoints that call external dependencies create their own outages. Keep liveness checks shallow and asynchronous.
Conflated signals → Tying liveness to database health makes Kubernetes restart healthy pods during dependency hiccups. Separate process checks from dependency checks.
Thundering herds → When all instances probe a slow dependency at once, they amplify the problem. Add jitter, caching, or backoff to probes.
Blind heartbeats → A timer-based heartbeat can keep firing even if the process is frozen. Couple beats with lightweight health metrics.
Split-brain clusters → Missed heartbeats due to latency or packet loss cause false failovers. Use quorum or acknowledgments before removing nodes.
Leaky information →
/healthendpoints that expose internals (like database names or versions) can become security risks. Keep responses simple: “ok” or status codes.
Wrapping up
A well-tuned system doesn’t just stay online; it stays composed.
It distinguishes between “I’m down” and “I’m overloaded,” between “restart me” and “leave me be.”
That clarity comes from engineers who understand what their tools are doing.
When you get those signals right, your services don’t just run; they recover. And that, more than uptime or speed, is what makes a system reliable.
👋 If you liked this post → Like + Restack + Share to help others learn system design.
Subscribe to get high-signal, visual, and simple-to-understand system design articles straight to your inbox: